The following are two sets of data – each consist of 7 observations (n=7).
Set#1: 10, 2, 3, 2, 4, 2, 5
Set#2: 20, 12, 13, 12, 14, 12, 15
1. For each set, compute the mean, medium, and mode under Central Tendency
2. For each set, compute the range, interquartile, variance, standard deviation under Variation
3. Compare your results between set#1 vs. set #2 by discussing the differences between the two sets.
4. Post your result and discussion on your blog.
When I first began this assignment, I started with consulting the R reference card for functions in R so I could find each of the functions I needed to complete this assignment. I was able to find all the functions I needed on the ref card except for a function to calculate the Most Frequent, or mode, of the values. After conducting some further research, I discovered that R does not have a built in function to calculate mode, so I began this assignment with inputting set 1 and 2 into R, as well as writing a custom function to find the mode of the sets.
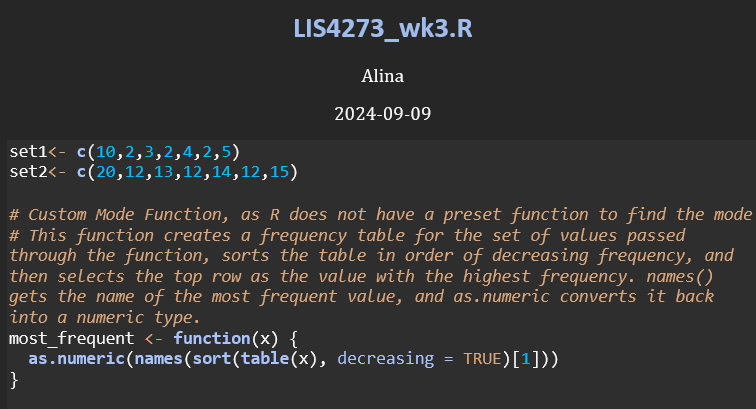
I called this function most_frequent(), as R already has a function called mode(); however, R’s mode() function does not return the most frequent value, but rather it returns the storage mode or the data type of an object, such as “numeric”, “character”, “logical”, etc.. When I tried using mode() during this assignment, it returned “numeric”. While helpful when developing my custom function for finding the most frequent value in the datasets, this was not what I was trying to find for this assignment.
With both sets of data input into R and my custom function for finding the most frequent value written, I was able to begin the assignment.
1. Compute the Mean, Median, and Mode for both data sets
2. Compute the range, interquartile, variance, standard deviation for both data sets
3. Compare your results between set#1 vs. set #2
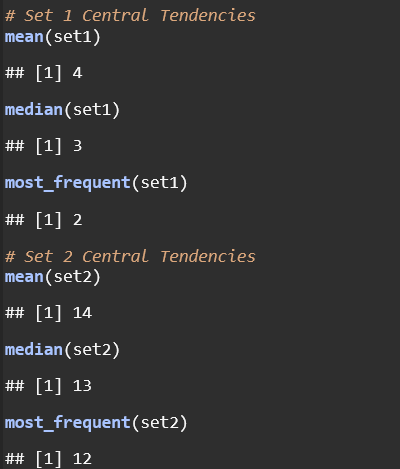
Something I noticed when I was inputting the values for set 1 and 2 was that the values of set 2 were simply the values of set 1 + 10. Because I noticed this, I was not surprised when the Mean, Median, and Mode of Set 2 was exactly 10 units higher than Set 1 across all central tendencies (Mean: 4 vs. 14, Median: 3 vs. 13, Mode: 2 vs. 12). However, what I was surprised about was that the measure of variation did not change at all from set 1 to set 2.
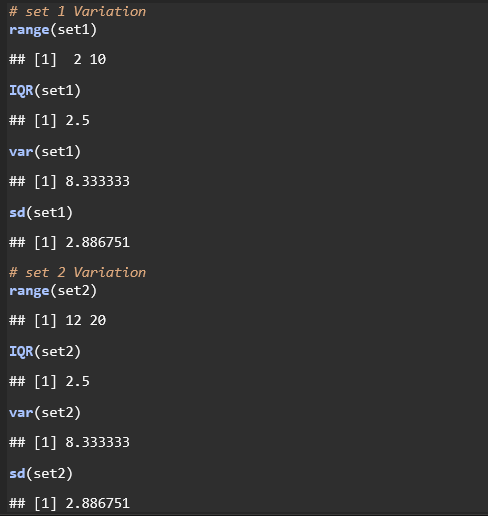
Both sets have the same range (8 units), the interquartile range (IQR) was 2.5 for both sets, as well as identical variance (8.333) and standard deviation (2.887). These identical data variations confirm that the shift by 10 did not affect the spread of the data, and that the spread of data points relative to their respective means remained unchanged.
What this tells me is that uniform shifts in data sets (such as, adding 10 to all values, for example), impacts central measures of tendency, but not variability. Both sets share identical statistical properties regarding spread (range, variance, standard deviation), emphasizing that adding a constant affects position but not dispersion.
4. Post your result and discussion on your blog
Completed September 9th, 2024

Leave a comment