Project Summary
Topic: Influences on TV IMDb Rating Success
For this project, I would like to look at how storytelling style (MotW vs Plot-Driven), release schedules, and episode types (e.g., season premieres, mid-season climaxes, finales) influence the success of episodically released TV shows using a dataset of episode data from the CW TV show Supernatural. By analyzing this long-running episodic series, I hope to uncover insights and offer recommendations to prospective show creators and production managers looking to create new episodic TV shows.
My analysis revealed several key findings: Plot-driven episodes consistently outperformed Monster-of-the-Week (MotW) episodes in audience ratings, highlighting the importance of engaging, overarching narratives. Season finales, which often deliver climactic resolutions, emerged as the highest-rated episode type, demonstrating that audiences value definitive and impactful conclusions. While release scheduling, including the time between episodes, showed no significant impact on audience reception or retention, my analysis found that long-running series face a gradual decline in ratings for plot-driven episodes, underscoring the challenge of sustaining narrative quality over time.
These results suggest that creators should focus on developing strong, concise storylines with clear resolutions and avoid overextending the length of a series. Prioritizing storytelling quality over strict adherence to release schedules will likely resonate more with audiences, as viewers are willing to wait for content they find compelling and well-crafted. These insights provide practical recommendations for crafting new episodic TV shows that maintain both audience engagement and critical acclaim.
The Case: Why Supernatural
Supernatural, a long-running CW series (2005–2020), is an ideal case study for episodic television. Spanning 15 seasons, the show follows Sam and Dean Winchester as they battle supernatural forces, evolving from a Monster-of-the-Week (MotW) format with self-contained episodes to a plot-driven drama focusing on overarching narratives and personal struggles. Alongside its storytelling evolution, Supernatural experimented with release schedules, alternating between consistent weekly airings and irregular gaps. These varied strategies, applied to the same core story and characters, allow for a controlled analysis of their impact on audience reception, offering valuable insights into how storytelling structure and release timing influence the success of episodic productions.
Step 1: The Dataset
The Dataset for this analysis was sourced from IMDb, the Internet Movie Database, and consists of 327 observations and 15 variables:
- episode_id: The overall number of the episode (1–327).
- episode_position: The episode’s position within its season (1–16/20/22/23).
- season_number: The season to which the episode belongs.
- episode_title: The title of the episode.
- director: The name of the episode’s director.
- writer: The writer(s) of the episode.
- air_date: The date the episode aired on The CW.
- days_between_episodes: How many days passed between episodes (aggregated variable).
- views_at_air_mil: How many people (in millions) watched the episode on its air date.
- imdb_rating: The IMDb rating of the episode.
- mow_filler: Whether the episode was a Monster-of-the-Week-style episode or filler (Boolean logic).
- episode_genre: The episode’s primary genre and subgenre (when applicable).
- centric_characters: Which main characters were central to the episode.
- s_d_solo_episode: Whether the episode was a Sam-and-Dean solo episode (Boolean logic; aggregated variable).
- episode_description: The episode’s description as listed on IMDb.

To begin my project, I started with loading any necessary libraries I would need to conduct my analysis, load in my dataset into R, and do any basic cleaning needed to work with the data (which primarily consisted of removing rows filled with NA values and ensure the data column in this dataset was being read as a date data type by R).

During this portion, I also went ahead and created a simple function that would print out whether I would need to reject my null hypotheses or fail to reject them based on a set significance level. For this project, I decided to use a 5% significance level across all my hypotheses tests.
############################
Sub-Section 1: One-off or Ongoing?
Step 2 and 3: Creating and Testing my hypothesis
Problem Description: Do IMDb episode ratings significantly differ based on the storytelling structure (MotW vs Plot-Driven)?
- Hypothesis:
- H0 : There is no significant difference in ratings between MotW and Plot-Driven episodes.
- H1 : There is significant difference in ratings between MotW and Plot-Driven episodes.
- Insight to be Gained: Determine whether storytelling style influences episode reception. By identifying whether audiences prefer plot-driven episodes or self-contained MotW episodes, show creators can better align their content with audience preferences
Analysis Technique: Two sample t-test, Linear Regression
To Begin this analysis, I divided my dataset into two sub datasets based on if the episode was considered a MotW episode or Plot Driven episode.

Through this process, I found out that Supernatural had 139 MotW Episodes and 188 Plot-Driven Episodes. Because there are 2 samples, and the data is not in pairs, I determined I would need to conduct a 2 sample T-test to determine if the average rating of these two groups is statistically different.


With that conclusion, I became curious on the impact of the progression of a show and the rating of each type of episode. I decided to build a Linear model to assess how/if the episode number and season number affected ratings of MotW and Plot -driven episodes


While the average IMDb rating of MotW episodes was not found to be significantly impacted by episode number overall nor season number, plot driven episodes were found to have a statistically significant negative relationship with total episodes number overall and season count, so has the show continues running, the ratings for plot driven episodes is going to slowly but consistently go down, while MotW episodes stay relatively consistent over a shows run time
My final question spurred by this topic was if the percentage of motv episodes in a seasons had a statistically significant impact on the overall season average. To study this, i am going to return to my spn dataset, calculate the average rating per season, the percentage of motw episodes per season, and see what that tells me.
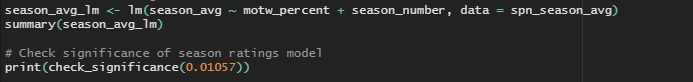
To answer that final question, I first needed to calculate the average rating per season and the percentage of MotW episodes in each season. Then, I built a linear model to assess if the percentage of MotW episodes and season number affected the overall season rating


Step 4: Summary of Results and Visualization
With these hypotheses tests, I came to the following conclusions about the impact of storytelling style on IMDb episode ratings:
- The average IMDb rating of MotW episodes is significantly lower than that of Plot-Driven episodes.
- The ratings of MotW episodes are not significantly affected by the episode number or season number.
- The ratings of Plot-Driven episodes are significantly influenced by episode number and season number (ratings decrease with progression).
- The overall average season rating is significantly impacted by the percentage of MotW episodes and season number. As the season number increases and the percentage of MotW episodes increases, the average season rating tends to decrease.
I created this visualization to help showcase the difference between storytelling styles and IMDb ratings


Related Work: This subsection is strongly related to the topics and methods we learned in Module 6 (One way and Two way Sample Tests) and Module 7 (Multiple Regression). Two Sample T Tests are primarily used to “Decide if the population means for two different groups are equal or not”, which was vital in this subsection, as this helped me determine if audiences responded to these two writing styles in statistically significant different ways. Meanwhile, the multiple regression methods from module 7 helped me how the progression of a shows season count and its percentage of MotW content influenced overall season ratings. This level of analysis, which accounts for multiple predictors, provided a deeper understanding of the data and revealed patterns that would not have been apparent through simple visualizations or single-variable regression.
############################
Sub-Section 2: Go out with a Bang?
Step 2 and 3: Creating and Testing my hypothesis
Problem Description: Does the position of an episode significantly impact it’s IMDb ratings?
- Hypothesis:
- H0 : The position of an episode (premiere, midpoint, last half, season finale) has no significant impact on its IMDb rating.
- H1 : The position of an episode significantly impacts its IMDb rating.
- Insights to be gained: Determine whether the timing of an episode within a season (e.g., premiere, midpoint, last half, or finale) affects audience reception of it. Understanding this relationship can help show creators and producers in planning the structure of a season and help determine how to best utilize production budgets (such as spending less poorly received episode positions or more on season premires or finales)
Analysis Technique: ANOVA and Tukey HSD
To begin this analysis, I needed to aggregate my dataset to recategorize the episode_position variable as a categorical factor, as not all seasons of the show were the same length. For this analysis, I wanted to look at the type of episode each position represented, rather than the literal numeric episode_position.

With this aggregation, the episode_position variable has been recategorized into 1 of 5 different groups, making it perfect for an ANOVA analysis which works best when there are more than 2 distinct groups.


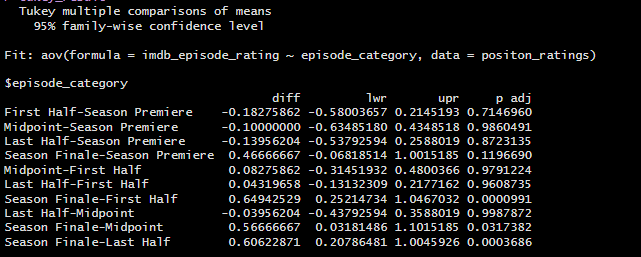
Because this model was found to be significant, I wanted to know which episode_position category performed the best of the five different options, so I decided to run a Tukey’s HSD test.

Step 4: Summary of Results and Visualization
With the results of these tests, I came to the following conclusions about the impact of episode position on overal season IMDb ratings:
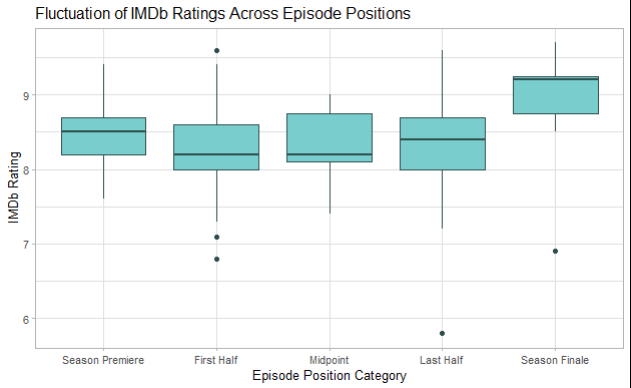
- Season Finales tend to have significantly higher IMDb ratings compared to the other categories (First Half, Midpoint, and Last Half).
- There is no significant difference in ratings between other episode position categories
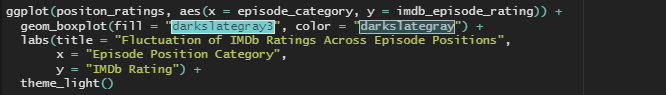
I created the following boxplot to visualize the fluctuation of IMDb ratings across episode positions, as well as identify outliers in episode position categories
Related Work: This subsection strongly related to the topics and methods we learned in Module 8 (ANOVA). ANOVA tests are used when comparing the average scores across 2 or more variables or categories. The techniques I used in this assignment greatly resembled the first question of Assignment #8, where we needed to look at the average scores across multiple categories of stress levels. However, instead of 3 stress categories, I looked at the difference of means across 5 different episode categories. This allowed me to investigate whether variations in scheduling impacted audience reception, providing a practical application of the concepts learned in the module.
############################
Sub-Section 3: Timing is Everything
Step 2 and 3: Creating and Testing my hypothesis
Problem Description: Do episodes with shorter gaps between air dates have higher viewership / IMDb ratings
- Hypothesis:
- H0 : The time between episodes does not have impact on audience viewership and/or rating
- H1 : The time between episodes does have impact on audience viewership and/or rating
- Insight to be Gained: Determines the impact of release scheduling on audience retention and reception. Understanding whether shorter or longer gaps between episodes improve reception can help optimize episodic release strategies.
Analysis Techniques: Descriptive Analysis (Measures of Central Tendency), ANOVA
To begin this analysis, I needed to aggregate my dataset to recategorize the days_between_episodes variable as a categorical factor.

Using this categorical factor, I calculated the following descriptive statistics to get a feel for the data and identify any obvious trends. I decided to look at both Mean and Median to account for any outliers.


At a glance, it did not seem like there was much fluctuation between the measures of central tendency across different time categories. However, to confirm this observation, I decided to move forward and conduct a hypothesis test anyways.
In this situation, I had the option to either run an ANOVA to test if the categorical factors categories have a significant impact on my response variable or build a linear regression model to test if the numeric days between episodes have a significant impact on the response variables. I chose to do a Linear Regression analysis because utilizing my numeric days variable over my grouped categorical factor would give me more precise answer to my question rather than an ANOVA group analysis. Plus, If this model proved significant, I would be able to see the impact of each additional day between episodes on IMDb rating, rather than giving show creators and producers a window of time.
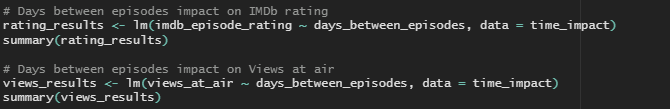
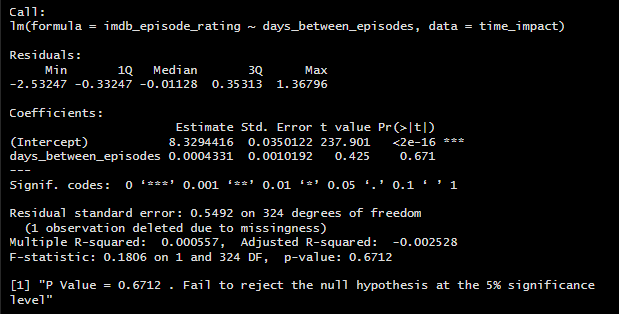
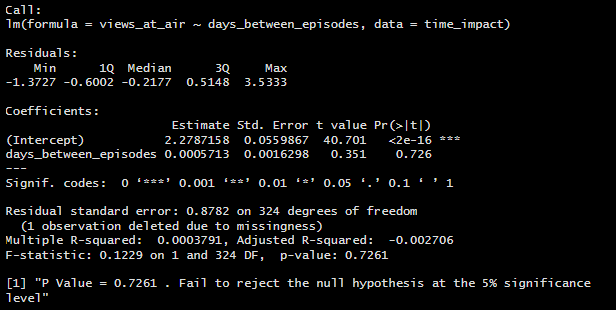
Step 4: Summary of Results and Visualization
The Linear Regression model confirmed my earlier observations, and I came to the following conclusion on the impact of days_between_episodes on IMDb ratings and Views:
- Time between episodes does not have a significant impact on audience perception of episode quality (episode ratings) or viewer retention
I created the following visualizations to showcase the both the change in IMDb rating and Views at air over the course of the show’s runtime, as well as the fluctuation (or rather, lack of fluctuation) of these variables across the categorical time factors.


Related Work: This subsection strongly related to the topics and methods we learned in Module 3 (Descriptive Statistics and Measures of Central Tendency) and Module 7 (Single Regression). While descriptive statistics are relatively basic measures, sometimes nothing can beat their sheer effectiveness of giving quick insights into complicated data patterns. Even before I ran my hypothesis test, I already had an inkling that the test would not prove significant simply based on this data’s measures of central tendency. By building and analyzing a single linear regression model, I was able to confirm these initial observations quantitatively, testing the relationships between my response variables (IMDb rating and Views) and verifying the limited influence of Days between Episodes. Together, these two, albeit simple statistical methods, demonstrated how a combination of descriptive and inferential techniques can provide both quick and robust insights of trends.
############################
Step 5: Project Conclusions and Final Recommendations
The findings of my analysis suggest that audiences prefer plot-driven episodes with concise, definitive conclusions. Plot-driven episodes consistently received higher ratings than MotW episodes, and season finales, the episodes that often deliver climactic conclusions, were rated the highest overall.
However, maintaining the quality of plot-driven episodes is critical, as their ratings tended to decline over time, particularly in later seasons. This indicates that while audiences value overarching narratives, the length of a series will eventually outpace even the best plot and audiences may lose interest if a show continues too long past its prime.
Interestingly, the time between episodes had no significant impact on audience perception of quality or viewer retention. This imples the idea that a well-crafted show can maintain its audience even with irregular release schedules and that viewers are willing to wait for episodes if they believe in the quality of the show.
To summarize, I recommend that prospective show creators and production managers:
- Focus on crafting strong, engaging, and concise plot-driven narratives.
- Ensure seasons have clear, compelling climaxes, particularly in season finales.
- Prioritize maintaining quality over long-term runs to sustain viewer interest.
- Avoid overemphasizing the importance of consistent release schedules: audiences care more about substance than timing.

Leave a comment