This is from the Multiple Linear Regression chapter 11 of “Introductory Statistics with R”, pg. 185-194
I revised this question, so please follow my description only. Conduct ANOVA (analysis of variance) and Regression coefficients to the data from cystfibr : data (” cystfibr “) database. Note that the dataset is part of the ISwR package in R.
You can choose any variable you like. in your report, you need to state the result of Coefficients (intercept) to any variables you like both under ANOVA and multivariate analysis. I am specifically looking at your interpretation of R results.
Extra clue:
The model code:
i. lm(formula = cystfiber$spemax ~ age + weight + bmp + fev1, data=cystfiber)
ii. anova(lm(cystfibr$spemax ~ age + weight + bmp + fev1, data=cystfiber))


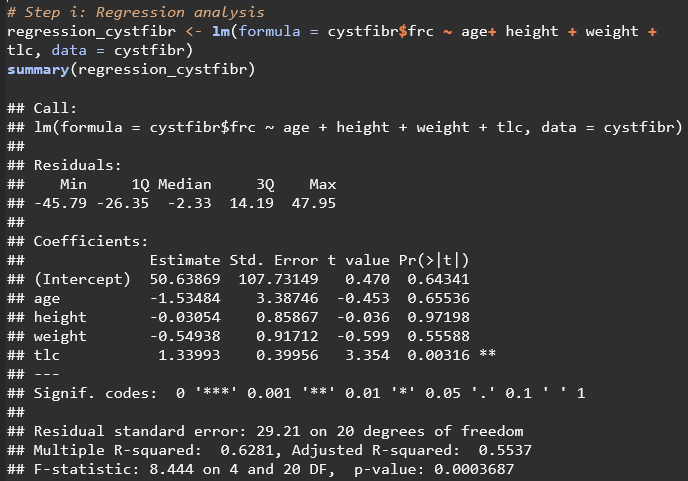
Interpretation of Regression Output:
INTERCEPT
50.63869 is the expected value of frc when all other predictors are 0
AGE
For every value that age increases (For every additional year in age), frc is expected to decrease by 1.53484
The P-value for this variable (0.65536) is not significant at any level
Conclusion: Age does not have a significant effect on frc according to this linear regression model
HEIGHT
For every value that height increases (For every additional cm), frc is expected to decrease by 0.03054
The P-Value for this variable (0.97198) is not significant at any level
Conclusion: Height does not have a significant effect on frc according to this linear regression model
WEIGHT
For every value that weight increases (For every additional kg), frc is expected to decrease by 0.54938
The P-Value for this variable (0.55588) is not significant at any level
Conclusion: Weight does not have a significant effect on frc according to this linear regression model
TLC
For every unit that tlc increases, frc is expected to increase by 1.33993
The P-Value for this variable (0.00316) is significant at the 0.01 level
Conclusion: tlc does have a significant effect on frc according to this linear regression model
Residual Standard Error: the average value of frc falls 29.21 values away from the regression line
Multiple R Squared: 62.81% of the variation of frc can be explained by these predictors
Adjusted R Squared: 0.5537, which accounts for the number of predictors in the model
F-statistic: 8.444 on 4 and 20 degrees of freedom, with a p-value of 0.0003687, indicating that the model as a whole is statistically significant at the highest level (0.001)
According to the Regression Results: the only significant predictor of this model is tlc with a positive coefficient, indicating that higher total lung capacity is associated with higher functional residual capacity. This model found that a moderate amount of variations in frc can be explained by this model, indicating that other factors not included in this analysis may be more heavily influencing frc.

Interpretation of the ANOVA Results
AGE
f-value 21.436: Ratio of Stress Mean Sq to the Residuals Mean Sq. F Value. Higher F value means the variability explained by age is much larger than the variability within the frc variable, which suggests that age contributes to significant differences in frc
Pr(>F) 0.000183 is less than the highest significant level of 0.001, which provides strong evidence to reject the null hypothesis (that age has no impact on frc).
HEIGHT
f-value 0.391
Pr(>F) 0.538611 is higher than the lowest significant level of 0.1, which does not provide sufficient evidence to reject the null hypothesis (That height has no impact on frc).
WEIGHT
f-value 0.156
Pr(>F) 0.697213 is higher than the lowest significant level of 0.1, which does not provide sufficient evidence to reject the null hypothesis (That weight has no impact on frc).
TLC
f-value 11.246: Ratio of Stress Mean Sq to the Residuals Mean Sq. F Value. Higher F value means the variability explained by tlc is much larger than the variability within the frc variable, which suggests that tlc contributes to significant differences in frc
Pr(>F) 0.003162 is less than the significant level of 0.01, which provides strong evidence to reject the null hypothesis (that tlc has no impact on frc).
According to the ANOVA results, we can reject part of the null hypothesis and report that age and tlc have a statistically significant impact on frc
Conclusion:
Both the linear regression and ANOVA analyses confirm that TLC has a significant positive effect on FRC. As TLC increases, FRC also increases. This aligns with medical expectations, as total lung capacity is directly related to the amount of air the lungs can hold after maximum inhalation. The significance level (p-value < 0.01 in both analyses) suggests a strong relationship, making TLC a critical factor in explaining variations in FRC.
Age’s role in predicting FRC are somewhat contradictory according to the linear regression and the ANOVA test. The linear regression did not identify age as a significant predictor of FRC, with a high p-value of 0.65536. However, the ANOVA showed that age had a significant effect (p-value < 0.001), suggesting that age does contribute to variability in FRC when considered separately. This discrepancy could indicate that age’s impact on FRC may be more apparent in univariate comparisons (like ANOVA) than in a multivariate context (like the regression model), possibly due to interactions with other variables.
Height and weight, however, do not have significant effects on FRC according to both of these models.

Leave a comment